 By Vineet Kumar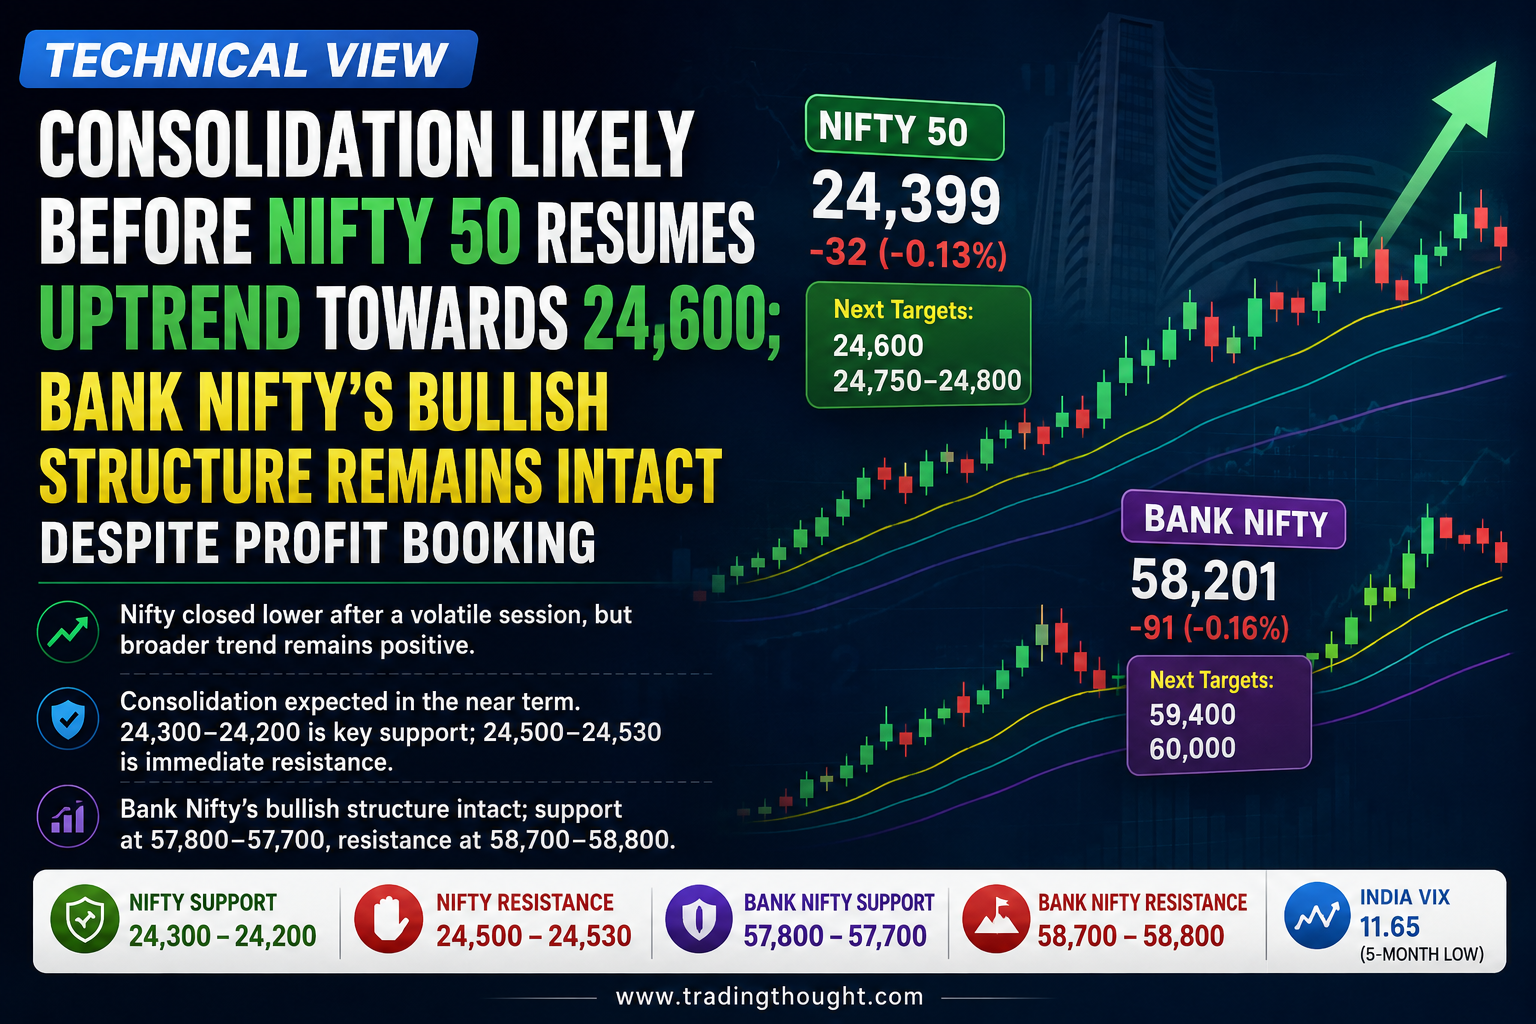
The Indian equity market witnessed profit booking on July 7 after a strong four-session rally, with the Nifty 50 ending a volatile trading session moderately lower. Despite the decline, the broader technical structure remains constructive as the benchmark continues to trade above key exponential moving averages and maintains its higher high–higher low formation.
The immediate market setup suggests that Nifty may spend the next few sessions in consolidation before attempting the next leg of its uptrend. The 24,500–24,530 zone has emerged as the first major hurdle, while a decisive breakout could open the path towards 24,600 and subsequently 24,750–24,800.
On the downside, the 24,300–24,200 region remains an important support area for short-term traders.
Nifty 50 Snaps Four-Day Winning Streak
The Nifty 50 opened the session above 24,400 and moved higher during the first half, touching an intraday high of 24,531.
However, the index failed to sustain at elevated levels as profit booking emerged during the second half of the session. Nifty slipped below 24,500 and later lost the 24,400 mark in late trade before finally settling at 24,399, down 32 points.
The price action indicates that sellers are becoming active near the 24,500 zone, making this area crucial for the next directional move.
On the daily chart, Nifty formed a bearish candlestick with both upper and lower shadows. Such a formation reflects indecision, suggesting that bulls and bears are currently competing for control after the recent upward move.
Nifty Trend Remains Positive Above Key Moving Averages
Despite Tuesday’s decline, the broader technical structure continues to favour the bulls.
Nifty remains comfortably above its 20-day, 50-day and 100-day exponential moving averages, indicating that the short- to medium-term trend remains positive.
Another encouraging technical development is the movement of the 10-day EMA above the 100-day EMA. The 10-day EMA had already crossed above the 20-day and 50-day EMAs in June, reflecting improvement in short-term momentum.
The index also continues to maintain a higher high–higher low structure, which is generally associated with an established uptrend.
As long as this structure remains intact and important support zones are defended, short-term declines may continue to be viewed as consolidation rather than a confirmed trend reversal.
Momentum Indicators Continue to Support Bulls
Momentum indicators remain constructive despite the latest round of profit booking.
The daily Relative Strength Index stood at 63.02, remaining above the important 60 mark. This suggests that positive momentum is still present without the index necessarily being in an extreme overbought condition.
The MACD setup also remains supportive. The positive histogram expanded for the fourth consecutive session, while the MACD continued to trade above both its reference line and the zero line.
Taken together, the RSI and MACD structure suggest that the broader bullish momentum has not yet been invalidated.
Nifty Support and Resistance Levels
The immediate technical battle is likely to remain concentrated between support near 24,300 and resistance around 24,500.
Immediate Resistance: 24,500–24,530
This zone is important because it includes Tuesday’s intraday high. Nifty needs to move convincingly above this area to regain short-term momentum.
A sustained breakout could shift focus towards 24,600.
Major Upside Zone: 24,750–24,800
If Nifty successfully clears 24,600 and sustains above the breakout area, the next major upside zone could emerge around 24,750–24,800.
Immediate Support: 24,300–24,250
This is the first important demand zone to watch. A controlled decline towards this region may attract buying interest.
Broader Support: 24,200
A break below the immediate support band could expose the index to 24,200, which remains important for maintaining the near-term bullish setup.
TradingThought View: What Should Nifty Traders Watch Next?
From the TradingThought perspective, the 24,500–24,600 band is now the most important decision zone.
A simple way to read the setup is:
Above 24,530: Short-term momentum may improve.
Above 24,600: Probability of a stronger continuation move may increase.
Between 24,300 and 24,500: Range-bound and selective trading conditions may continue.
Below 24,300: Risk of a deeper pullback towards 24,250–24,200 could increase.
The current setup does not favour aggressive chasing at elevated levels. A more selective approach may be preferable until the index either breaks decisively above resistance or offers a better risk-reward opportunity near support.
Weekly Options Data Signals Key Battle Near 24,400–24,500
The weekly options setup suggests that the 24,400–24,500 zone could play a major role in deciding the next directional move.
At a broader level, 24,000 remains an important support area, while 25,000 is likely to act as a major psychological and options-based resistance zone.
This makes the immediate 24,400–24,500 region particularly important for short-term traders. Sustained acceptance above the upper end of the range could strengthen bullish sentiment, while repeated rejection may prolong consolidation.
India VIX Falls to Nearly Five-Month Low
India VIX declined 1.44 percent to 11.65, reaching its lowest level since February 11 and marking a nearly five-month low.
The decline in volatility suggests improving comfort among market participants and a relatively stable trading environment.
However, traders should remember that very low volatility does not eliminate market risk. Periods of compressed volatility can sometimes be followed by sharp expansion, especially around major domestic or global triggers.
For this reason, disciplined position sizing and stop-loss management remain important.
Bank Nifty Technical View: Bullish Structure Survives Profit Booking
Bank Nifty also witnessed profit booking after approaching the 58,600 region during intraday trade. The banking index eventually settled at 58,201, down 91 points.
Although the index formed a bearish daily candlestick, the broader chart structure remains constructive.
Bank Nifty continues to trade above key moving averages, suggesting that the underlying trend remains positive despite short-term selling pressure.
Moving Average Structure Signals Improving Strength
One of the key bullish developments is the crossover of the 50-day EMA above the 200-day EMA.
The 50-day EMA is also approaching a potential crossover above the 100-day EMA, indicating improvement in the medium-term trend structure.
As long as the index continues to hold above important support levels, the current decline may remain part of a normal consolidation process rather than the beginning of a major bearish reversal.
Bank Nifty RSI Remains in Strong Zone
The daily RSI stood at 63.45 and recently rebounded after finding support near the 60 mark.
This is a constructive signal because it indicates that momentum remains positive even after profit booking.
The ability of the RSI to sustain above 60 would continue to support the bullish case. A meaningful deterioration below key momentum levels, however, would require closer attention.
Bank Nifty Resistance at 58,700–58,800
The 58,700–58,800 zone remains the most important hurdle for Bank Nifty.
This region is technically significant because the previous swing high is located around the same area.
A decisive breakout above 58,800 could trigger renewed momentum and potentially open the path towards:
59,400
60,000
The 60,000 level remains an important psychological milestone and could become a major target if the breakout is supported by strong participation.
Bank Nifty Support at 57,800–57,700
On the downside, immediate support is placed around 57,800–57,700.
As long as Bank Nifty remains above this support band, the broader bullish structure is likely to stay intact.
A controlled correction towards this zone could attract buying interest. However, a decisive breakdown below the support area would weaken the immediate setup and could increase the probability of a deeper correction.
TradingThought View: Key Levels at a Glance
For Nifty 50, the immediate support zone is placed at 24,300–24,250, followed by 24,200. Resistance is visible at 24,500–24,530, followed by 24,600 and 24,750–24,800.
For Bank Nifty, immediate support is placed at 57,800–57,700, while the key resistance zone remains 58,700–58,800. A successful breakout could bring 59,400 and 60,000 into focus.
Market Outlook
The broader technical picture remains constructive despite the latest profit booking.
Nifty appears to be entering a short consolidation phase after four consecutive sessions of gains. The 24,500–24,600 resistance band remains the key obstacle for the next upward leg, while 24,300–24,200 is the important support region.
Bank Nifty continues to show a stronger underlying structure, supported by positive moving-average alignment and healthy momentum indicators. The 57,800–57,700 support zone remains critical, while a breakout above 58,800 could potentially trigger the next rally towards 59,400 and 60,000.
For short-term traders, the coming sessions may require greater selectivity. Instead of chasing prices at higher levels, monitoring reactions near clearly defined support and resistance zones may offer better risk-reward opportunities.
Disclaimer: This article is intended solely for educational and informational purposes and should not be considered investment advice, a trading recommendation or a solicitation to buy or sell any security. Market conditions can change rapidly. Readers should conduct their own research and consult a qualified financial advisor before making investment decisions.
Disclaimer: This article is for educational purposes only. Consult a qualified financial advisor before making investment decisions.
Disclaimer: This post is strictly for educational and informational purposes only. Trading Thought is not a SEBI registered advisor. The analysis provided does not constitute financial, investment, or trading advice. Please consult with a certified financial professional before making any investment decisions.